Statistical cartography 1810s / 1860s
Minard measures the cost of the Russian campaign
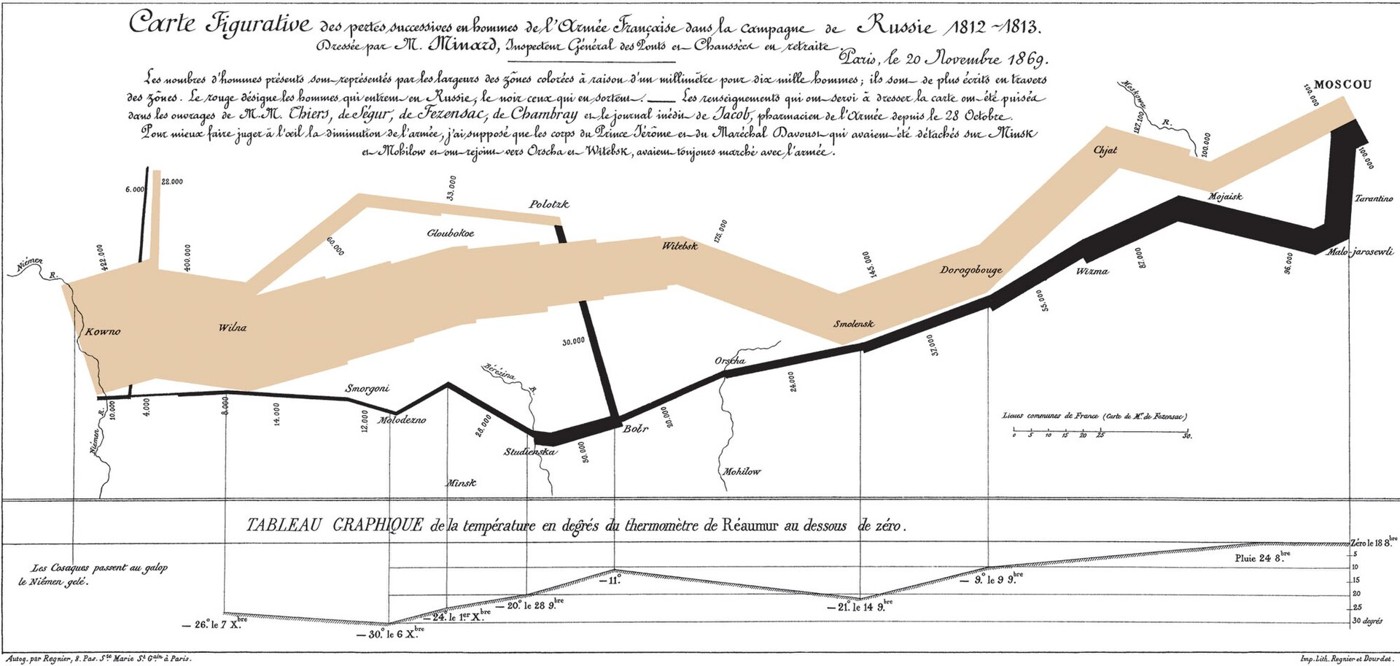
Charles Joseph Minard published this graphic in 1869, more than half a century after Napoleon’s invasion of Russia. He turned the campaign into a geographical account of loss: a broad outward band narrows on the journey toward Moscow, and a dark return band dwindles further. Rivers, branches of the march and temperatures share the page with troop counts. It is an engineer’s retrospective construction from historical information. The result draws attention away from a sequence of victories and defeats toward the shrinking number of people who continued along the route.
About the picture
Band width carries the troop numbers, so a thinning route also becomes a visible loss of people. Below the retreat, the temperature line uses the Réaumur scale. Geography and weather are brought into the same reading space, though the chart does not assign every death to a single cause.
The history behind it
What the source establishes
The strongest conclusion comes from combining the encodings while preserving their limits. The changing bands communicate severe changes in troop strength along the campaign route, and the aligned temperature series adds environmental context to the return. Their juxtaposition is not an individual casualty register, and the branching groups also warn against equating every change in width with a death. The artist’s date, 1869, is different from the represented campaign, 1812–1813. Finally, degrees of Réaumur cannot be read as though they were degrees Celsius. The record rewards attention to title, key, chronology and units together.
Dates, places and close alternatives
The graphic is an 1869 retrospective of an 1812–1813 campaign. Kowno and Moscow frame the represented eastward advance and westward return. Width describes troop numbers; the lower chart is a separately scaled temperature series, not individual cause-of-death data.
Linked variables do not identify every individual story
The troop flow and temperature line can be read together without pretending that each change has one diagnosed cause. Branches show why the flow must be interpreted as a system rather than a list of individual deaths. The graphic’s own key establishes its encoding; its title and publication statement establish separate historical dates. Keeping those roles clear makes the analysis stronger while leaving individual experiences for additional evidence.
A few things to read next
Books for a longer visit, and a few good places to start online. These are ordinary links, with no affiliate commission.
On the bookshelf
The Visual Display of Quantitative Information
For a close discussion of statistical graphics and the design choices Minard made.
A History of Data Visualization and Graphic Communication
Places Minard’s flow maps within the broader history of visual communication.
Russia Against Napoleon
Adds military and political context from the Russian side of the conflict.
Read online
Charles Joseph Minard
A starting point for names, dates and related subjects. Follow its references when you want to go further.
Minard in the history of data visualization
A guide to Minard’s flow map and other graphical work.
Great Migration: A Graphics Novel
A scholarly discussion of movement graphics that situates Minard’s influential example.
Where the pictures come from
The original records and their individual rights statements are below. The pictures have not been generated or altered for the game.
Minard’s 1869 graphic of the losses in Napoleon’s Russian campaign of 1812–1813.
Charles-Joseph Minard, 1869 / Wikimedia Commons · 20 November 1869; depicts the 1812–1813 Russian campaign
Public domain; nineteenth-century printed chart and reproduction identified as public domain on the item page.
History notes and reading lists prepared for Data Barnacle with AI assistance. The source institutions and authors are not sponsors or endorsers. Suggest a correction or another source