Public health and data 1854–1855
Mapping the 1854 Soho cholera outbreak
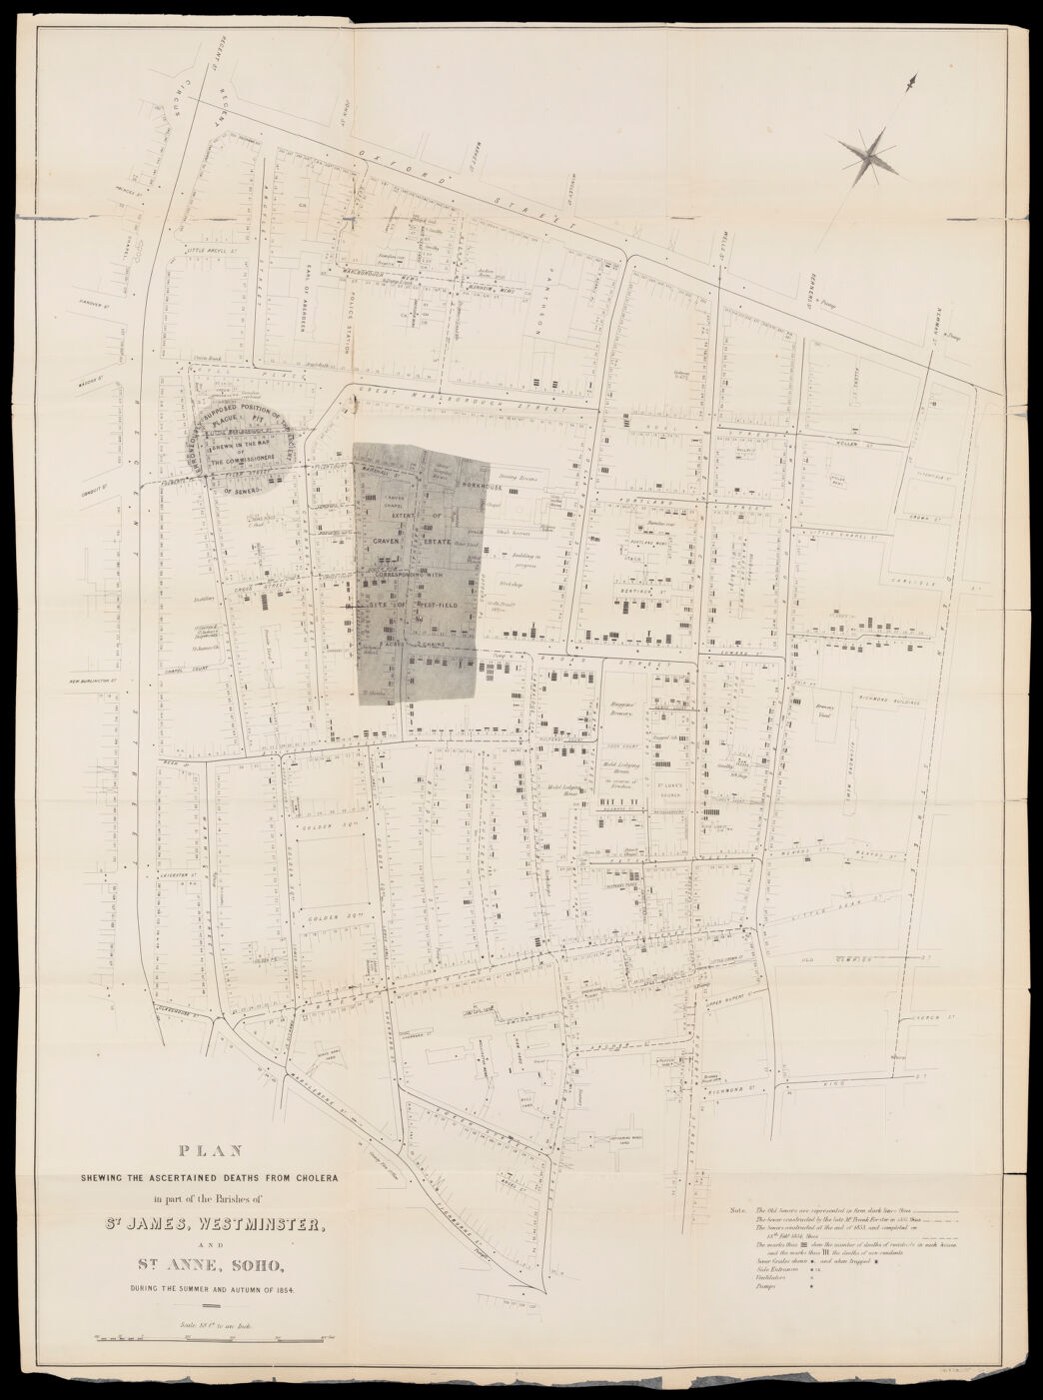
During the 1854 cholera outbreak in London’s Soho district, John Snow investigated where people had obtained their drinking water. The familiar map of deaths around Broad Street became part of the argument for waterborne transmission. Its black marks turn individual losses into a pattern that can be compared with streets and pumps. The version preserved here accompanied the parish inquiry’s report in 1855, after the outbreak. It belongs to a larger investigation involving household inquiries, water suppliers and local knowledge, rather than a single glance at a map that instantly solved the epidemic.
About the picture
The marks count recorded deaths at particular addresses, while pump locations show a possible relationship between water access and mortality. Mapping made the neighborhood’s pattern visible on one sheet. Snow also needed interviews and other evidence to understand people’s water use, including cases that did not fit a simple distance-from-the-pump explanation.
The history behind it
The documented reconstruction
The mapped episode is the 1854 Soho-area cholera outbreak, while the committee’s report followed in July 1855. Keeping those dates separate prevents a retrospective visualization from being mistaken for a live recording of an intervention. The item’s wording also matters: ascertained deaths are not automatically all infections, and a local mapped cluster is not a population-adjusted national rate. The sound next step is to compare the pattern with household water use, population and other local evidence. This recognizes the map’s investigative value without making it single-handedly prove a biological mechanism or the cause of every case.
Reading the source
This plan carries several kinds of scope: a particular locality, a particular disease episode and a particular kind of recorded outcome. Each matters. A mapped death is not automatically a complete account of infections, and an intense cluster is not by itself an adjusted risk rate. The later report date also places the document in retrospective inquiry rather than at every mapped moment.
Questions for further research
The map can direct more precise questions about where people obtained water and how populations differed across the area. Answering them requires records of exposure and suitable comparisons. This is a productive limit: a spatial source can organize an investigation without supplying all of its evidence or independently demonstrating a biological mechanism.
A few things to read next
Books for a longer visit, and a few good places to start online. These are ordinary links, with no affiliate commission.
On the bookshelf
The Ghost Map
An accessible narrative centered on Snow, Henry Whitehead and the Soho investigation.
Water 4.0: The Past, Present, and Future of the World’s Most Vital Resource
How drinking-water systems and treatment developed in response to urban needs and disease.
The Sanitary City: Environmental Services in Urban America from Colonial Times to the Present
A wider history of water, waste and the institutions built to manage city health.
Read online
1854 Broad Street cholera outbreak
A starting point for names, dates and related subjects. Follow its references when you want to go further.
Map, Myth and Error Making in the Broad Street Pump Outbreak
A careful account of when Snow’s maps appeared and what they contributed.
Historical development of epidemiology
Places Snow’s local inquiry beside his comparisons of London water suppliers.
Where the pictures come from
The original records and their individual rights statements are below. The pictures have not been generated or altered for the game.
Plan Showing the Ascertained Deaths from Cholera
Wellcome Collection · Mapped events: 1854; associated report presented July 1855
Public Domain Mark — free of known copyright restrictions.
An original editorial digest of the cited catalog facts; not a second historic eyewitness document.
Wellcome Collection · Editorial digest reviewed 2026-11-01
Original Data Barnacle wording summarizing factual catalog data; underlying artifact rights are stated on the image.
History notes and reading lists prepared for Data Barnacle with AI assistance. The source institutions and authors are not sponsors or endorsers. Suggest a correction or another source