Medical statistics 1850s
Florence Nightingale’s campaign in numbers
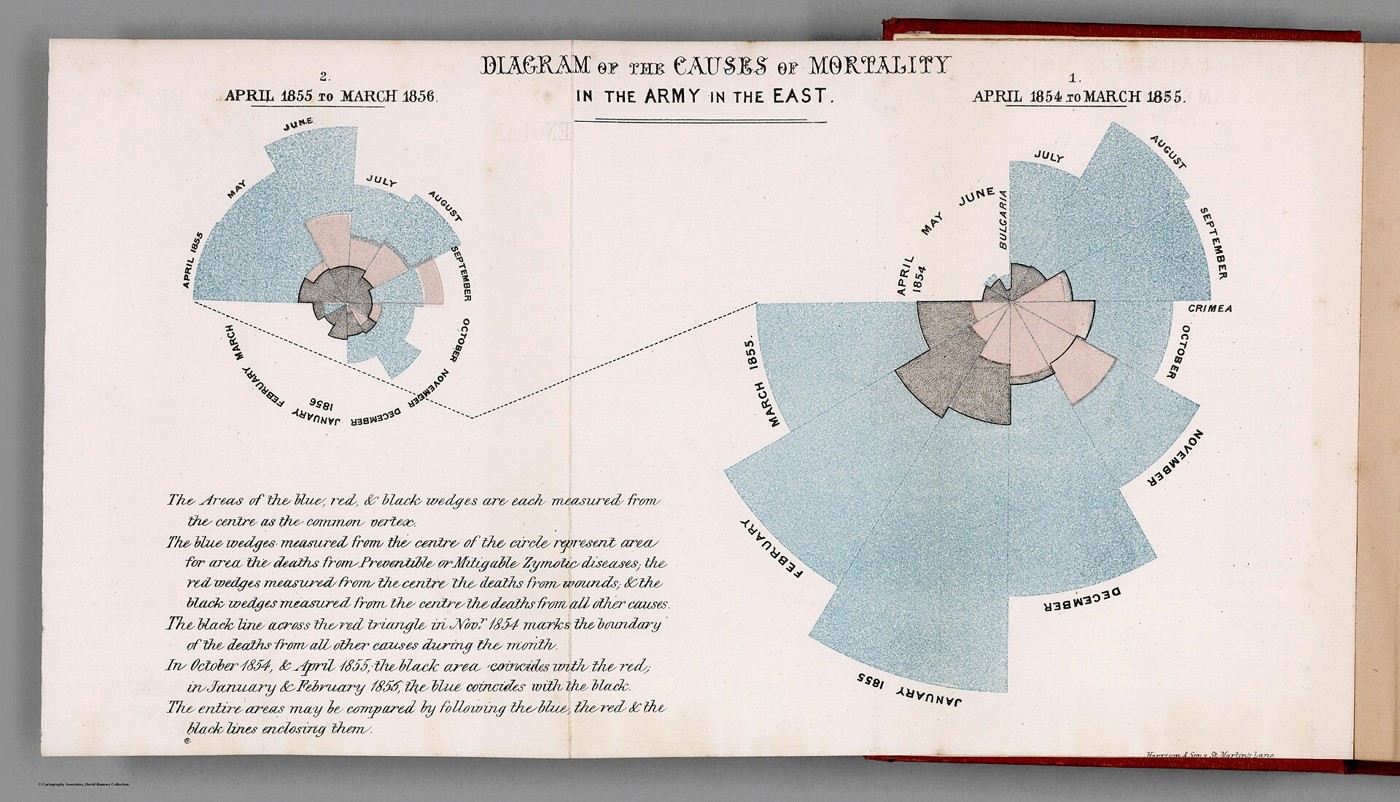
Florence Nightingale’s work after the Crimean War extended far beyond the ward. She gathered mortality figures and pressed for changes in military health administration. This diagram compares successive years in the British Army in the East, distinguishing deaths attributed to disease, wounds and other causes. Its large blue areas made preventable illness difficult to overlook. The terminology belongs to nineteenth-century medicine, and the figures summarise populations rather than individual experiences. Alongside her written reports, such graphics helped turn the conditions of military service into a subject of public argument and reform.
A closer look: Two circles of mortality
Each month occupies a wedge, with the coloured areas measured outward from the centre. The blue disease category dominates much of the display. Nightingale used this striking form to make the scale of sickness legible to readers who might otherwise remember the war chiefly through battlefield injuries.
A closer look: A separate street-level survey
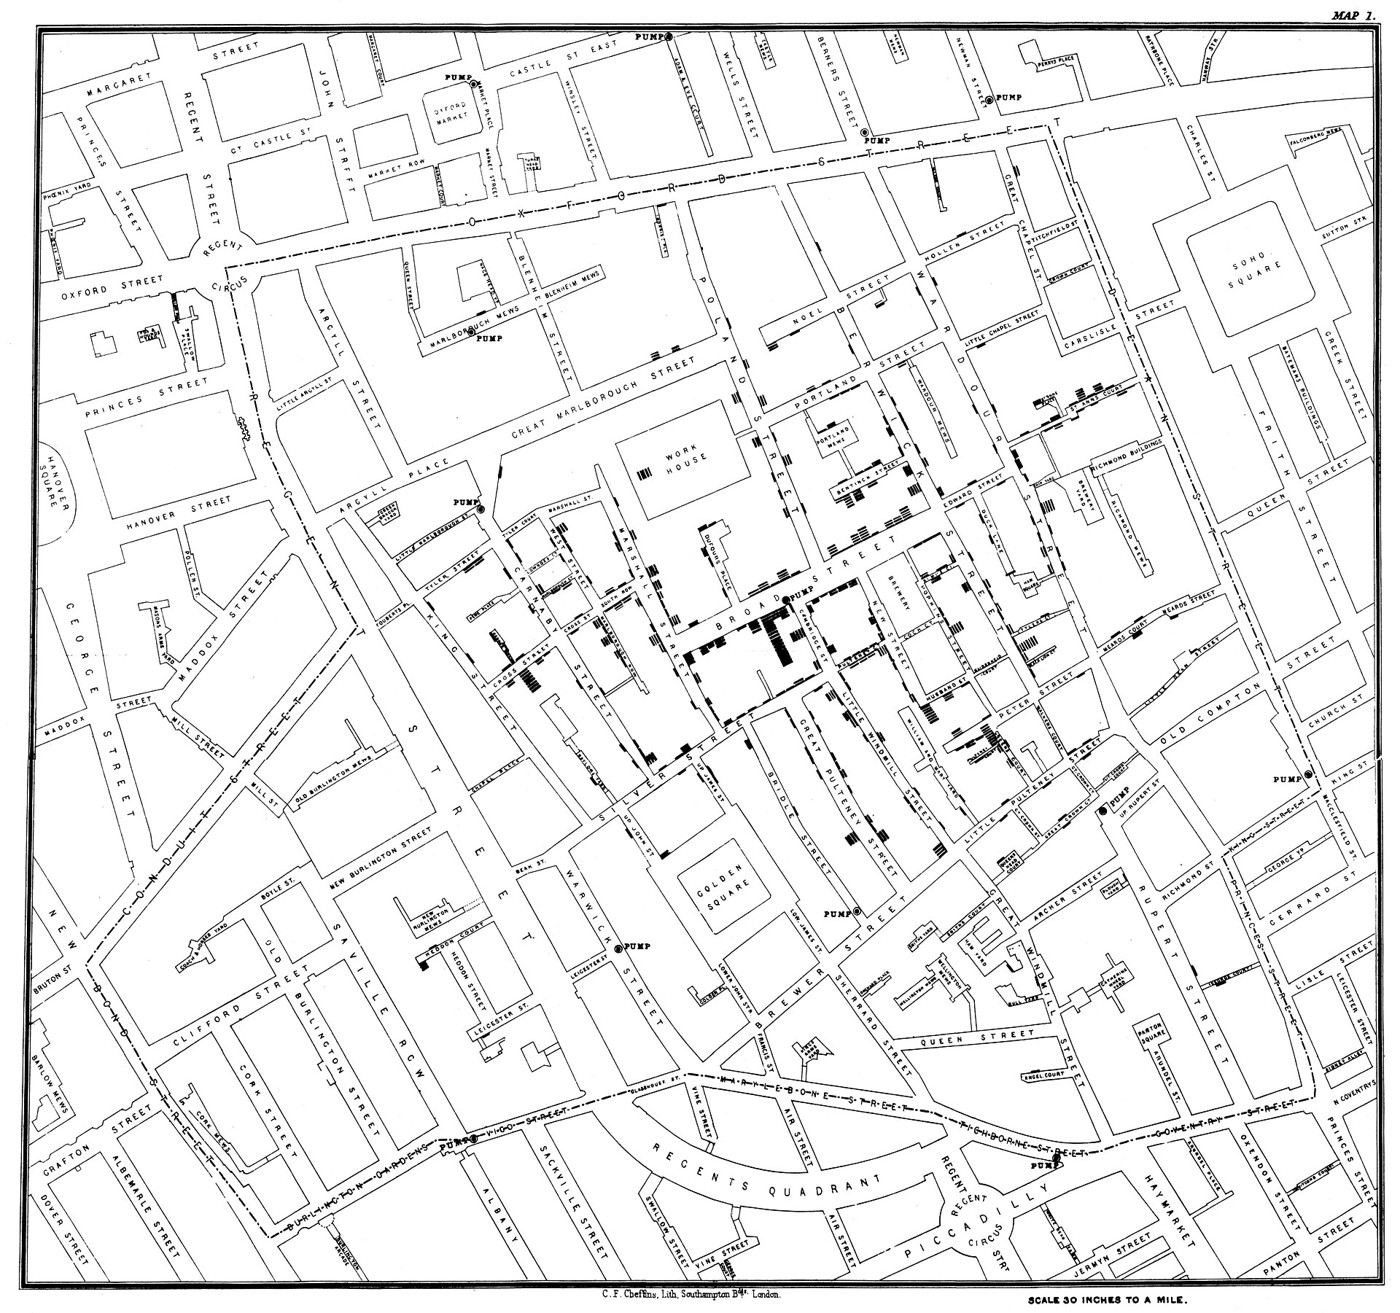
Snow’s street map concerns civilians in London during the 1854 cholera outbreak. Its bars locate deaths beside addresses, unlike Nightingale’s monthly Army totals. Together, these objects show two different ways nineteenth-century investigators used visual records to reason about health: one organised by place, the other by time and cause.
The history behind it
What the source establishes
The diagram invites two easy errors: reading its circles in ordinary left-to-right order and treating its coloured regions as stacked slices. Both are resolved by the printed headings and key. The earlier year is on the right, and the areas of the different causes are independently measured from the centre. The striking blue areas communicate the importance of disease in recorded mortality. That conclusion is stronger than any claim that the plate alone identifies precisely which reform caused the subsequent reduction. Historical diagnostic categories and the distinction between aggregate comparison and controlled causal evidence matter here.
Dates, places and close alternatives
The headings span April 1854 through March 1856, irrespective of the later publication context. The named population is the Army in the East; the plate is not confined to one ward or all civilian residents. The diagram associates large mortality with its disease category, while causal attribution to one reform needs more evidence.
Read the key before comparing the picture
Direction of reading is not a safe substitute for numbered headings. Likewise, a colour boundary can overlap another boundary without creating an extra independent quantity to add. The original explanation of measurement is part of the evidence. A later reader should preserve the historical disease category and compare the years it actually names, while separating that aggregate pattern from a more demanding claim about one reform’s isolated causal effect.
A different population
The additional street survey is a genuine record, but it does not count the British Army in the East. Its deaths and pumps cannot be added to the army’s monthly mortality totals or used to isolate the effect of one army reform. Similar subject matter and nearby dates do not make two documents observations of the same population. That is why identifying an irrelevant source is part of the investigation.
A few things to read next
Books for a longer visit, and a few good places to start online. These are ordinary links, with no affiliate commission.
On the bookshelf
Florence Nightingale: The Woman and Her Legend
A biography that follows Nightingale’s reform work as well as her nursing.
A History of Data Visualization and Graphic Communication
Historical context for Nightingale’s graphic choices and the development of statistical displays.
The Visual Display of Quantitative Information
For a closer look at how area, colour and comparison communicate quantities.
Read online
Florence Nightingale
A starting point for names, dates and related subjects. Follow its references when you want to go further.
Florence Nightingale: The Lady with the Lamp
Her wartime experience, statistics and subsequent reform work.
John Snow and the Pump Handle
Background for the separate Soho map included with this collection.
Where the pictures come from
The original records and their individual rights statements are below. The pictures have not been generated or altered for the game.
Diagram of the Causes of Mortality in the Army in the East; late-1850s printed plate.
David Rumsey Map Collection, 10563.002 / Internet Archive, via Wikimedia Commons · Data April 1854–March 1856; diagram issued in the late 1850s
Public domain historical diagram; item record marks the reproduction public domain.
Map associated with John Snow’s account of the 1854 Soho cholera outbreak.
John Snow / Charles Cheffins; digital reproduction via Wikimedia Commons and UCLA · 1854 outbreak; reproduced in Snow’s 1855 book
Public domain; the item record identifies the historical map and its reproduction as public domain.
History notes and reading lists prepared for Data Barnacle with AI assistance. The source institutions and authors are not sponsors or endorsers. Suggest a correction or another source